Nationwide property values flat amid variability
Residential property values have stabilised at a national level in recent months according to the QV indices for February, but there is considerable variability across the country.
Nationwide values gradually declined throughout most of 2010, but in the past few months have begun to flatten before increasing slightly between January and February. Values are 1.7 percent lower than the same time last year, and 5.6 percent below the market peak of late 2007.
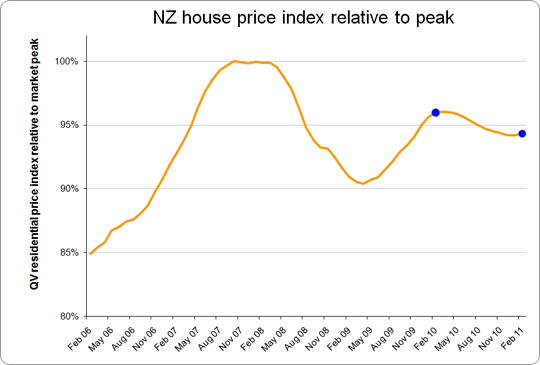
“Values for all New Zealand have levelled off in recent months, but this is mostly due to a rebound in values in the main centres. In contrast, values in the rural and provincial areas have generally continued to decline” said QV.co.nz Research Director, Jonno Ingerson.
“Overall the property market remains subdued with lower than normal numbers of listings and sales being the main signs of buyer and seller caution. However there are pockets of the market that remain active, particularly in the main centres.
“There is variability in how values have changed over recent months, even within the main centres. Values across the Auckland area increased in the last month, particularly in central Auckland, with the rest of Auckland remaining more or less steady. Values across the wider Wellington area were steady, but increased in Hutt and Upper Hutt, were flat in Wellington City, and decreased in Porirua. In contrast values in Hamilton and Tauranga have continued to steadily decline” said Mr Ingerson.
“In Christchurch, the market took a while to start moving again after the September quake, but once it did there were some positive signs. Increased demand for undamaged houses saw prices lift by a few percent in the subsequent months and in February values were 0.3 percent above the same time last year. The much more widespread damage caused by the February quake will again cause sales activity to slow for several weeks or even months. It is too early to tell what the effect on values of relatively undamaged houses will be” said Mr Ingerson.
While unrelated to the QV index, and a less reliable measure of value change, the average New Zealand sales price over the last three months is $411,712 which is slightly up on the $409,067 reported last month.
The continuing slide in values in recent months means that none of the provincial centres now have values above the same time last year. Compared to this time last year Whangarei is -5.3 percent, Rotorua -3.2, Gisborne -7.0, Hastings -2.8, Napier -0.5, New Plymouth -3.0, Wanganui -4.3 and Palmerston North -3.6. In the South Island Nelson has now dropped below last year by 0.1 percent, while recent increases in value mean that Queenstown Lakes is only 0.3 percent below last year, and Invercargill 2.8 percent below.
.jpg)
Main Urban Area Commentary
Auckland
QV’s Residential Price Index for February shows that property values increased in the last month but remain 0.4% below the same time last year in the Auckland region. Different parts of the Auckland area are continuing to trend differently, but generally remain fairly stable.
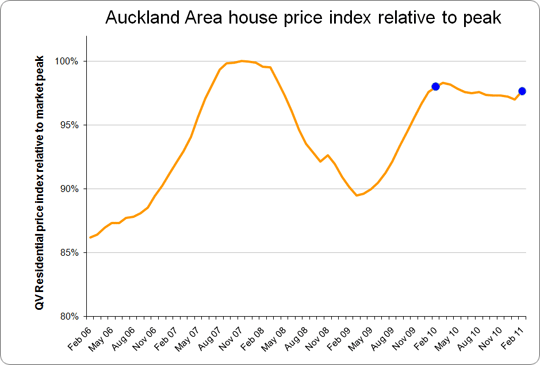
Ms Glenda Whitehead of QV Valuation said “Within the Auckland region there is a sense of stability. This is reflected in the fact that the values in each area are close to the same levels last month and very similar to what they were a year ago. The only exception is Auckland City values, which rose over the past month, and are now slightly higher than the same time last year”.
“There appears to be increased demand for quality new listings in the former Auckland City. Following some successful auctions and quick sales, there is a feeling that the short supply of quality listings is driving this market positively. This may be causing a localised trend” Ms Whitehead said.
Ms Whitehead said “Demand for property is also apparent in Waitakere, with some strong results in recent weeks. Agents have reported a steady demand but a shortage of listings in a number of suburbs. First home buyers appear to be the main group purchasing the properties with investors absent in most cases.”
Ms Whitehead said “There is not the same optimism being seen in the wider market. South Auckland for example, has seen little activity, with a lack of both listings and sold signs. In Papakura and Franklin demand for lifestyle properties continues to be low, sales are taking a long time and prices continue to ease. Lower values are being accepted to make a sale in a timely manner. Though there are some new residential subdivisions on the outer perimeters of former Papakura and Franklin Districts that appear popular. This may be due to being affordable for the type of home, such as four bedroom home with two bathrooms, in comparison to property closer to Auckland city.”
QV’s Residential Price Index is calculated using sales data from the 3 months leading up to the month being reported. It is not the same as the average sales price, which fluctuates in line with the mix of properties selling in upper or lower price brackets. The average sales price for the Auckland region in February was $549,474.
Hamilton
QV’s Residential Price Index for February shows that property values have decreased by 3.9% over the past year in Hamilton. Values continued to fall over the past couple of months.
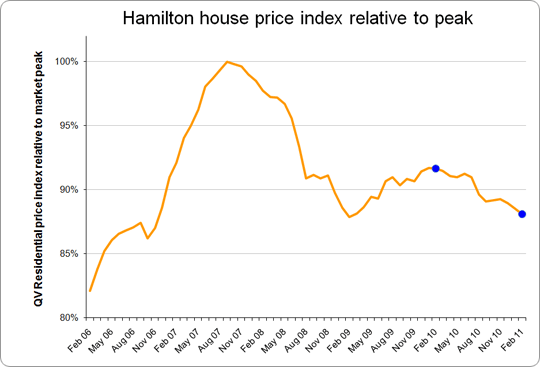
Mr. Richard Allen of QV Valuations said “The values in Hamilton have continued to slide. This varied by location when you compare month on month. North East and South East of Hamilton decreased whereas South West and Central City/North West showed a slight increase. Overall the average sale price has decreased to its lowest level in twelve months”.
“The surge in sales activity and volume that traditionally occurs over summer has not happened this year and Hamilton’s residential market remains subdued” Mr Allen said.
QV’s Residential Price Index is calculated using sales data from the 3 months leading up to the month being reported. It is not the same as the average sales price, which fluctuates in line with the mix of properties selling in upper or lower price brackets. The average sales price for Hamilton in February was $337,946.
Tauranga
QV’s Residential Price Index for February shows that property values have decreased by 3% over the past year in Tauranga. Values have continued to fluctuate over the past couple of months, generally in a downward trend.
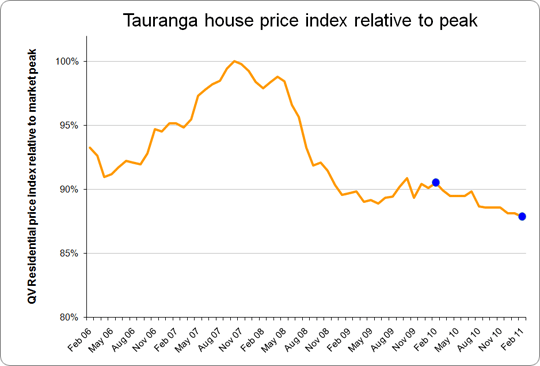
Mr. Shayne Donovan-Grammer of QV Valuations said; “Property values in Tauranga have continued to ease. This is the continuation of the pattern over the last eighteen months to two years. The market is very subdued with little activity.
“There are no indicators that suggest the market will improve in the short to medium term. Buyers in this region purchase for capital gain and with that unlikely for quite some time they are understandably cautious” said Mr Donovan-Grammer.
QV’s Residential Price Index is calculated using sales data from the 3 months leading up to the month being reported. It is not the same as the average sales price, which fluctuates in line with the mix of properties selling in upper or lower price brackets. The average sales price for Tauranga in February was $400,907.
Wellington
QV’s Residential Price Index for February shows that property values in the Wellington region have decreased by 2.7% over the past year. There has been an improvement in values in recent months following the decreases seen throughout most of 2010.
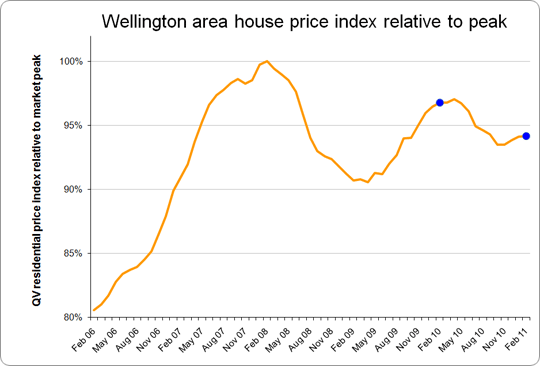
Mr Kerry Buckeridge of QV Valuations said “Once again whilst we have seen low sales volumes, which was the case last month, values have still increased slightly.”
“There had been an increase in properties being listed and a reasonable number of people looking to purchase. However, agents have advised buyers are not committing to properties if they are not exactly what they are seeking” Mr Buckeridge said.
“In the general the low to medium valued properties appear to be selling quite readily provided they are well presented and competitively priced. It is rare for buyers to make a premium offer. This is only seen in a few instances where properties have attracted a lot of interest and competition” Mr Buckeridge said.
Mr Buckeridge said “Residential investors had also started being a little more active but they were firmly yield focused. There is no evidence of investment buyers factoring potential capital gains into their decisions.”
Mr Buckeridge said “There has also been a noticeable increase in the number of potential vendors wanting guidance on the value of their property. A significant proportion of work is also coming from people looking to re-finance or top-up mortgages on their existing property – possibly indicating a trend toward people enhancing their existing property rather than trading up.“
QV’s Residential Price Index is calculated using sales data from the 3 months leading up to the month being reported. It is not the same as the average sales price, which fluctuates in line with the mix of properties selling in upper or lower price brackets. The average sales price for Wellington in February was $459,278.
Christchurch
The major quake on February 22nd has caused much more extensive damage to Christchurch than the September 4th quake. It is too early to say exactly what impact this will have on the housing market in Christchurch, although what happened between September and February may give us something of a guide.
After the September quake, the number of house sales slowed dramatically for a few weeks, but then began to recover in subsequent months. New sales and those already in the pipeline in September were delayed for several weeks as potential buyers sought engineers’ reports to ensure the structural integrity of the house they were about to buy, and there were also delays in getting LIM reports due to damage to the Council storage facilities. While badly damaged properties were not selling, houses in less damaged areas were beginning to sell again, and in November sales numbers were nearly back up to pre-earthquake levels. December and January saw a typical seasonal slowdown in activity, and any sales underway in February prior to the quake will now take some time to come through.
In the months leading up to the September quake, house values in Christchurch were gradually declining, as they were across much of the country. Immediately after the earthquake house values began to increase, and by November had risen about 3% before levelling through to February. If we assume that values would have continued to decline if there had been no September earthquake, then house values in February were probably 5% higher than they would have been.
This jump in values was due to increased demand for houses in unaffected areas, both from people within Christchurch, and from people outside the region moving in to assist with the rebuild.
While the property market in less damaged areas was beginning to return to normal following the September quake, the February quake has clearly changed that. An assessment of how many properties have been badly affected has really only just begun and is likely to take some time to complete. The wider impact of the February quake also means that it is likely to take longer for the property market to get moving again.
Christchurch will clearly be going through a great deal of change in the coming months and possibly years. Decisions still need to be made on which areas need to rebuilt, and how and when that happens. There is likely to again be an increase in demand for houses in less affected areas both from people within and outside Christchurch. The people of Canterbury are also only just coming to terms with what has happened, and while for some people property decisions have become a matter of necessity, for others it may be the last thing on their minds. Some people are determined to stay in Christchurch – the place they call home; others have decided to leave permanently for the sake of themselves and their families. The housing market is heavily influenced by consumer sentiment, and it is almost impossible to predict how these various factors will influence the sentiment of the people of Canterbury and therefore what impact it will have on the property market.
The QV house price index is based on the last three months of sales data. For the next few months this sales data will be both slow to come through, and will mostly be from prior to the February quake. As a result we will suspend publication of the index for Christchurch, and possibly Selwyn and Waimakariri Districts if the sales volumes prove to be too low. We will provide regular updates of the housing market across Canterbury as soon as there is sufficient data to do so.
Dunedin
QV’s Residential Price Index for February shows that property values in Dunedin have decreased by 2.9%. Values improved slightly last month following a declining trend in months prior.
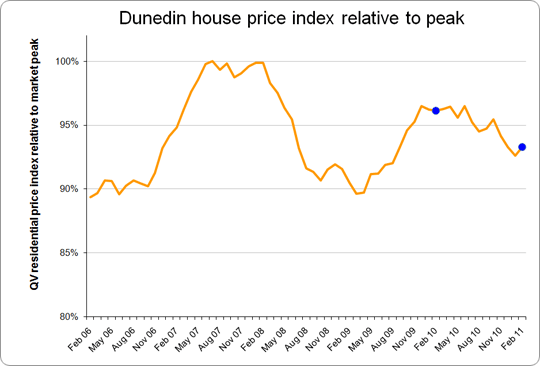
Mr. Tim Gibson of QV Valuations said “The Dunedin City residential property market has not changed significantly in February when compared to late 2010. Even though values for Dunedin City showed a small increase for February it is too early to indicate whether this means values are stabilising. Also, the sales volumes are still lower than the same period in 2010.”
“There appears to have been greater interest in lower valued property compared to late 2010. The likely reason for the renewed interest in these properties is the lower values, which have made them a more desirable investment” Mr Gibson said.
Mr Gibson said “Location is still considered an important factor, with good condition properties in desirable localities around Dunedin City generally selling quickly. Properties with maintenance issues or in less desirable locations are taking longer to sell, and generally require a significant price reduction in order to sell.”
QV’s Residential Price Index is calculated using sales data from the 3 months leading up to the month being reported. It is not the same as the average sales price, which fluctuates in line with the mix of properties selling in upper or lower price brackets. The average sales price for Dunedin in February was $270,544.
Posted: 8 Mar 2011
News articles
Browse articles
by date


