Home loan affordability improves for first time in 2009
The BNZ Home Loan Affordability measure improved in May from April, which was the first monthly improvement in 2009.

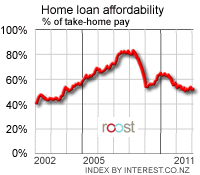
A slight fall in the median house price and flat interest rates helped reduce the proportion of after-tax pay needed to service a mortgage on a median home to 55.9% in May from 56.4% in April.
This is sharply better than the 80.6% seen a year ago and the record worst level of 83.4% in March last year, said Interest.co.nz, which produces the series of national and regional reports for BNZ.
Affordability improved in an unbroken run through 2008 as interest rates fell sharply and house prices fell. A rise in after-tax incomes because of wage inflation and a tax cut helped extend the trend. But that run of improvement ended in February, March and April this year as house prices stopped falling and interest rates began to bottom out.
 “Home loan affordability has improved dramatically in the last year and home buyers will welcome this slight improvement again after a few months of stagnation,” said BNZ General Manager of Strategy and Marketing Blair Vernon.
“But home buyers can’t take further improvement for granted. House prices and interest rates would have to fall again for affordability to get better,” Vernon said. “The housing market has been more stable in recent months and longer term mortgage rates have been rising,” he said.
The indefinite delay of tax cuts planned for 2010 and 2011 puts all the weight on interest rates and house prices as sources for further improvement.

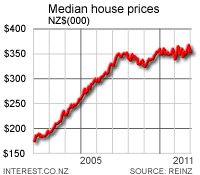
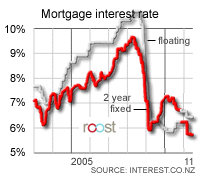
The REINZ median house price fell to NZ$337,500 in May from NZ$340,000 in April, while the average 2 year mortgage rate was flat at 6.23%. These two factors reduced the proportion of a single median income needed to service an 80% mortgage on a median priced house to 55.9% in May from 56.4% in April. This was first improvement in any one month in 2009, but it remains off its best levels in 5 years of around 54% in January and February.
Affordability hit its worst level of 83.4% in March 2008 just after house prices peaked and 2 year mortgage rates were close to 10%.
Many home buyers jumped in March and April to take advantage of lower interest rates and look for bargains, which improved the number of houses sold and stabilised prices. But short term mortgage interest rates flattened out in late March and longer term mortgage rates began to rise in line with rises on wholesale markets.

Affordability remains slightly out of reach for most individual home buyers. The threshold proportion of after tax income considered prudent to sustainably own a house is around 40%. Anything above that is starting to become unaffordable.
Affordability also improved for a typical first home buyer. The Housing Affordability report’s measure shows the mortgage servicing proportion improved to 44.1% in May from 44.8% in April. This measure is for a median income earner aged 25-29 buying a first quartile home. Interest.co.nz thinks the ‘affordable’ threshold is 40% for such a home buyer.
The report’s measure of affordability for a ‘typical’ household shows that proportion fell to 36.6% in May from 36.9% the previous month. This ‘typical’ household includes one 30-34 year old male earning a median income, one 30-34 year old female earning 50% of a medium income and one child over five. Interest.co.nz thinks the ‘affordable’ threshold is 30% for such a household.
 The report’s measure of a ‘typical’ first home buying household shows the proportion required to buy the first quartile home improved to 22.8% in May from 23.2% in April. It has, however, improved from 34% a year ago and 34.9% at its peak in November 2007. This measure is for one full time male aged 25-29 and one full time female aged 25-29 with no kids. Interest.co.nz considers the affordability threshold for this group as 30%, although that doesn’t leave room for children.
Southland continued to be the cheapest region in the nation with the typical home buyer having to pay 32.6% of take-home pay to afford the mortgage on a median house. The most expensive region was the Central Otago Lakes region on 76.3%, although this is down from 115.4% a year ago.
See all the Standard Home Loan Affordability reports here.
See all the First Home Loan Affordability reports here.
This article is kindly republished courtesy of Interest.co.nz
To read this and other articles click here
Posted: 19 Jun 2009
News articles
Browse articles
by date


